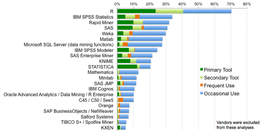
The most popular data analytics language
By joe
- 3 minutes read - 583 words… appears to be R
[

](http://revolution-computing.typepad.com/.a/6a010534b1db25970b019b00077267970b-popup)
This is in line with what I’ve heard, though I thought SAS was comparable in primary or secondary tool usage. This said, its important to note that in this survey, we don’t see mention of Python. Working against this is that it is a small (1300-ish) self-selecting sample, and the reporting company has a stake in the results. Also of importance is that R is a package with an embedded programming language, and Python is a programming language with add-ons. This is critical when you discuss tools, sort of like comparing a programmable numerical control machine (R) to a hand held drill unit with attachments. One is built specifically for the analysis, one isn’t. So it really is no wonder that comparing Python to R for big data analytics would result in people (who know better than to do such a comparison) saying, “seriously, WTF?” More useful to this discussion is comparing pre-packaged versus home grown tools, as well as mixed use (both pre-packaged and home-grown). This is where the kdnuggets surveys show interesting results. You can examine the data from 2009 to 2013 easily. One of their conclusions was that
and the data itself showed
Python, by contrast declined to 13.3% from 14.9% in 2012. Now understand that the number of (again, self-selecting, and possibly biased) respondents more than doubled between 2012 and 2013. Note that I didn’t see Java, Perl, or any of the other languages that showed up in the 2012 survey. Indeed, a conclusion from the 2012 survey was
Note that there were 798 confirmed participants in 2012, and 1880 in 2013. So 13.3% of 1880 represents about 250 people, versus 14.9% of 798 in 2012 represents about 119 people. I rounded up/down to nearest integer (I am not sure what a fractional person actually means). So from this, it appears that Python usage doubled (from the survey’s perspective, given all its problems) in a year. But it appears that the market is growing faster than that, so its relative usage actually declined. So even if we place huge error bars on the numbers to reflect the likely impacts of bias, self-selection, etc., its hard to draw a conclusion that Python is replacing R. More to the point, its hard to draw a conclusion that Python is replacing anything. Again, this is not a bash on Python. It is a competent language for tying other things together. The language is, at its core, slow, and you need things like numpy, pandas, and other tools written in other languages to give it speed. Which in the era of big data is extraordinarily important. But its pretty obvious that its' not replacing anything. It appears to be, at best, static. At worst, declining, though you’d have to accept the surveys as faithful samples of the population as a whole, and not as biased self-selecting segments with an agenda or motive to influence the outcome in a particular direction, in order to take that view. Also, note how the survey results have changed. They started out with tools like Excel dominating. Now look where Excel is in 2013. Things change, and likely this time next year, we will see different things. Analysis of surveys and historical data is, by definition introspective. We can build an extrapolating model from this, at the risk associated with all such models … they could be wrong, their theoretical/pragmatic basis could be shaky/non-existent. So lets see what happens next year.